Align GPT partitions on 4K sector disks

I’m upgrading the storage in a offsite backup server to two new disks. The new disks are of 3TB each which pose some challenges when it comes to partitioning. Here is a quick background to this issue.

Why is it an issue to partition disks larger than 2TB?

Historically, data stored on the actual disks have been stored in 512 byte chunks, called a sector. 32 bit addressing of sectors creates the following limit:

512 bytes * 2^32 = 2199023255552 bytes = 2T bytes

And there you have it. Newer disks have transitioned to “4K”/4096 bytes physical sectors which extends this limit to 16TB. But…

Why is partition alignment crucial to storage performance?

To complicated things further, disks often expose 512 bytes logical sectors to the operating system for legacy support. This might cause tools to believe it is okay to begin and end a partition on any 512 byte sector border, which might not be a 4K byte sector border that is stored on the disk.

Hardware.info has a good article illustrating this.
Wikipedia on 4K / Advanced Format

How do you align partitions in Ubuntu with GNU Parted?

GNU Parted is a tool that supports GUID Partition Table, GPT, setup under Linux. Parted have some parameters to aid in the alignment of partition starts and ends. Let’s launch parted with:

$ sudo parted --align optimal /dev/sdX

Where sdX is the drive we intend to view and/or modify. The –align optimal is the aid in the alignment. In parted we can view the current partition table with the command print:

(parted) print
Model: ATA ST3000VX000-1CU1 (scsi)
Disk /dev/sdX: 3001GB
Sector size (logical/physical): 512B/4096B

As we can see, the drive has 4K physical sectors but presents 512 logical sectors. A tricky part I struggled with for hours was to calculate the partition sizes with the unit set to sectors. In my opinion, parted could be more clear on what sector size it presents to the user. To figure this out I issued the following:

(parted) unit B
(parted) print
Model: ATA ST3000VX000-1CU1 (scsi)
Disk /dev/sdX: 3000592982016B
...
(parted) unit s
(parted) print
Model: ATA ST3000VX000-1CU1 (scsi)
Disk /dev/sdX: 5860533168s

Making the calculation, bytes per sectors:

3000592982016B / 5860533168s = 512 byte/sector

So, even though this is a 4K drive, parted is using 512 byte sectors for viewing partition starts, ends and sizes.

Setting up partitions with parted

First, let’s setup a gpt partition table with the following command:

(parted) mklabel gpt

This was the partition layout I wanted to achieve:

Partition Size Usage
sdX1 8GB swap
sdX2 250GB /
sdX3 1200GB raid
sdx4 1542GB raid

Initially, I tried calculating the partition sizes using the sector unit to make sure that each partition border aligned with the physical sectors. Often, parted complained about the alignment with:

Warning: The resulting partition is not properly aligned for best performance.

What helped was to use the unit MB for the starts and ends. Here is the final parted commands:

mkpart primary 1 0% 8000MB
mkpart primary 2 8000MB 258000MB
mkpart primary 3 258000MB 1458000MB
mkpart primary 4 1458000MB 100%

Notes: Using 0% default to the first 1MB border that is correctly aligned. The same goes for 100% which makes sure the last partition aligns with the end of the disk. Here is the resulting partition layout:

(parted) unit s
(parted) print
Model: ATA ST3000VX000-1CU1 (scsi)
Disk /dev/sdX: 5860533168s
Sector size (logical/physical): 512B/4096B
Partition Table: gpt

Number Start End Size File system Name Flags
1 2048s 15624191s 15622144s 1 
2 15624192s 503906303s 488282112s 2
3 503906304s 2847655935s 2343749632s 3 raid
4 2847655936s 5860532223s 3012876288s 4 raid

(parted) unit compact
(parted) print
Model: ATA ST3000VX000-1CU1 (scsi)
Disk /dev/sdX: 3001GB
Sector size (logical/physical): 512B/4096B
Partition Table: gpt

Number Start End Size File system Name Flags
1 1049kB 8000MB 7999MB 1
2 8000MB 258GB 250GB 2
3 258GB 1458GB 1200GB 3 raid
4 1458GB 3001GB 1543GB 4 raid

To verify that the partitions are aligned, the following command can be executed, with P being the partition number:

(parted) align-check optimal P
P aligned

This became a long post. In the future I will try to cover handling alignment between the filesystem layer and the partitions.

Let me know how it goes for you!

Storage performance: Intel Z87 vs. ASMedia ASM1062 vs. LSI 9211-8i

During my VT-d verification on the ASRock Z86 Extreme6 I took the opportunity to compare the performance of three different storage controllers, namely:

  • Intel Z87 (onboard)
  • ASMedia ASM1062 (onboard)
  • LSI 9211-8i (PCI-Express 8x add in card)

Below is a summary of the test setup and the results of the tests.

Test System

Native performance

Comparison of the three controllers are done with the simple hard disk benchmark tool in Ubuntu 13.10.

SSD Performance

Average read [MB/s] Average write [MB/s] Average access time [ms]
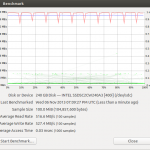
Intel Z87 516.6 527.4 0.03
ASMedia ASM1062 402.2 398.4 0.04
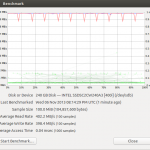
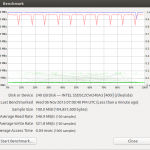
LSI 9211-8i 546.9 521.8 0.04

Intel-SSD ASMedia-SSD LSI-SSD

HDD Performance

Average read [MB/s] Average write [MB/s] Average access time [ms]
Intel Z87 140.3 136.1 12.4
ASMedia ASM1062 140.3 136.0 12.5
LSI 9211-8i 140.3 136.6 12.4

Intel-HDD ASMedia-HDD LSI-HDD

Passthrough Performance

Passthrough performance is measured with ESXi 5.5 installed on a USB memory and the LSI card passed through to a VM. The VM is running the same version as in the above benchmarks, ubuntu 13.10. The performance is only run with the LSI card. I really tried getting passthrough working with the ASMedia controller as this would open up to some interesting storage opportunities with this board. However, Ubuntu recognized the controller but did not find any disk attached to it. Also, now that I think about it, I have no idea why I did not think about trying to pass through the Z87 controller. Anyway, here is the comparison, SSD and HDD combined.

Average read [MB/s] Average write [MB/s] Average access time [ms]
SSD – Native 546.9 521.8 0.04
SSD – Passthrough 519.3 520.2 0.06
HDD – Native 140.3 136.6 12.4
HDD – Passthrough 140.3 136.4 12.4

LSI-SSD LSI-SSD-passt

LSI-HDD LSI-HDD-passt

Final thoughts

The ASMedia controller is not capable of handling the performance of modern SSDs. For mechanical drives there is practically no difference between the three different controllers.

I had an idea of using the Intel controller for the ESXi datastore and pass through the ASMedia controller to a VM. Then it would be possible to setup software RAID for the drives connected to the ASMedia controller. This is a solution working very well for me today with the LSI card, but it would have been nice to have an all-in-one solution.

There are some performance impacts on reads when passing through the LSI card to a VM. I have not investigated this further but it might very well be benchmark technical reasons behind it.

Some quick HDD and SSD benchmarks

I have been able to run some benchmarks on various hard drives and a solid state drive. Mostly for my own amusement to see how old drives compares to new drives. There are some desktop drives as well as some enterprise drives. Perhaps the numbers can be useful for someone.

The drives

Listed in some kind of old/slow to new/fast

  • Seagate Barracuda 7200.11 (ST31500341AS), 1.5TB
  • Seagate Barracuda 7200.12 (ST500DM002), 500GB
  • Samsung SpinPoint F3 (HD502HJ), 500GB
  • Hitachi GST Deskstar 7K1000.D (HDS721010DLE630), 1TB
  • Western Digital Red (WD20EFRX), 2TB
  • Seagate SV35.6 Series (ST2000VX000), 2TB
  • Seagate Constellation CS (ST2000NC000), 2TB
  • Seagate Constellation ES (ST3000NM0033), 3TB
  • Intel 520 SSD (SSDSC2CW240A3), 240GB

Test system

  • Asus P8Z68-V (Intel Z68 chipset)
  • Intel 2600K
  • 2x4GB RAM
  • Ubuntu Desktop 10.04.3
  • Ubuntu Disk application used for the benchmarks

The system is kind of old, but I have collected the numbers for some time and wanted to run the drives on the same platform. The drives were connected to the onboard SATA-III/6G ports, connected to the Z68 chipset.

*Update* I believe I have screwed up and actually used the SATA 3G ports for some of the drives. I will rerun the benchmark with the Constellation ES and SSD drive and update this post. The other drives are in production and I’m unable to test them.

Results

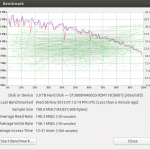
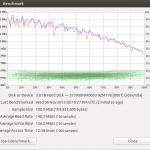
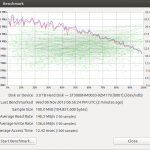
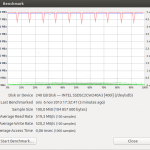
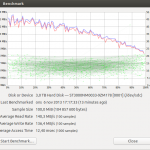
ST31500341AS ST500DM002 HD502HJ HDS721010DLE630 WD20EFRX ST2000VX000 ST2000NC000 ST3000NM0033 SSDSC2CW240A3

Reflections

I am not going to do an in depth analysis of the results, since I realize the procedure was way too sloppy. There are some really strange write results for the Constellation ES drive shown here. I tried running the same benchmark with Ubuntu 12.04 and it was more consistent with less spikes/dips.

Hopefully I will be able to post some other interesting benchmarks soon.